
Imagine you open your advertising dashboard and see this:
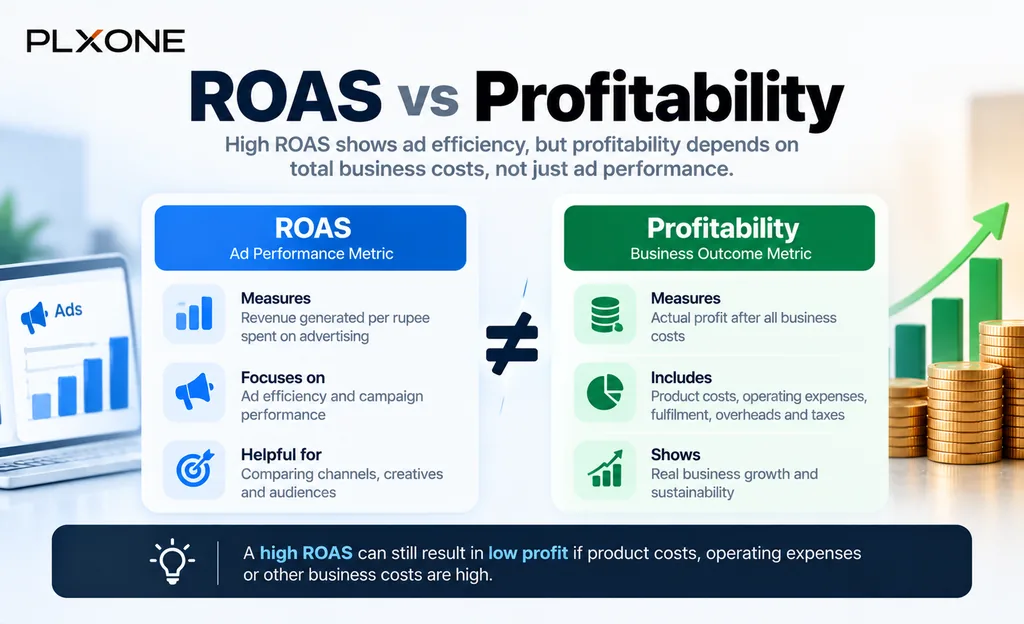
ROAS = 5
Looks good, right?
I used to look at numbers like this and feel that the campaign was working.
After all, if I spent ₹1 and generated ₹5 in revenue, what could be wrong?
But there is a problem with that thinking.
Revenue is not profit.
I learned this the hard way from my own Google Ads experience.
At one point, I was spending around ₹2.5 lakh a month on Google Ads. The campaigns were generating activity, but the total revenue generated from that ad spend was only around ₹95,000.
That means the numbers looked very different when I stopped looking at advertising activity and looked at the business outcome.
₹95,000 ÷ ₹2,50,000 = 0.38 ROAS
And even that revenue wasn’t profit.
You still have to pay for the product.
Then shipping.
Payment fees.
Discounts.
Returns.
And all the other costs involved in running the business.
So here’s the question I want you to ask the next time you see a strong ROAS in your dashboard:
“How much money did we actually make after generating that revenue?”
That question changed the way I look at advertising performance.
A campaign can have a high ROAS and still fail to create healthy profit.
And sometimes, a campaign with a lower ROAS can make more business sense if it brings better customers, stronger margins, or more valuable purchases.
That’s why I don’t look at ROAS as the final answer.
ROAS is a signal. Profitability is the business outcome.
In this article, I’ll show you how ROAS works, what a “good” ROAS really means, and why optimizing the number without understanding the underlying business economics can lead you in the wrong direction.
What Is ROAS?
ROAS stands for Return on Ad Spend.
It is a marketing metric used to measure how much revenue is attributed to an advertising campaign compared with the amount spent on that advertising.
The basic formula is:
ROAS = Attributed Revenue ÷ Advertising Spend
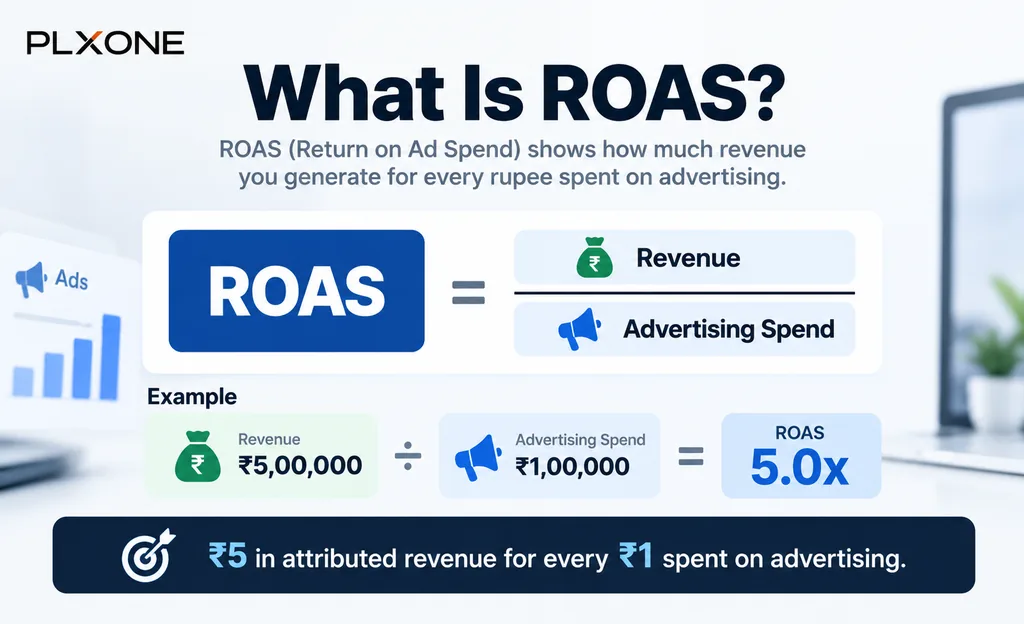
So if an advertising campaign generates ₹4,00,000 in attributed revenue from ₹1,00,000 in ad spend:
₹4,00,000 ÷ ₹1,00,000 = 4
The ROAS is 4.
That means the campaign generated ₹4 in attributed revenue for every ₹1 spent on advertising.
You can express ROAS as a number:
ROAS = 4
Or as a return:
400% ROAS
Both represent the same calculation.
One important word in the formula is “attributed.”
The revenue you’re using isn’t necessarily all the revenue the business generated during that period. It is the revenue that your advertising platform or measurement system attributes to the advertising activity.
That’s why the way conversions and revenue are tracked matters when you’re evaluating ROAS.
ROAS is therefore useful for answering one specific question:
“How much attributed revenue are we generating relative to our advertising spend?”
That makes it a useful advertising performance metric.
But before deciding whether a particular ROAS is good or bad, we need to understand how to calculate it correctly and what numbers should actually go into the calculation.
What Is a Good ROAS?
Let’s say you open your dashboard and see:
ROAS = 5
Would you call that good?
Most people probably would.
But I would not make that decision from the ROAS number alone.
I learned this from my own Google Ads experience.
At one point, I was spending around ₹2.5 lakh a month on Google Ads. The campaigns were generating activity, but when I looked at the total numbers, the revenue generated was only around ₹95,000.
That means:
₹95,000 ÷ ₹2,50,000 = 0.38 ROAS
In other words, every ₹1 spent on advertising generated only ₹0.38 in revenue.
That made one thing very clear to me:
Advertising spend and revenue cannot be looked at separately.
But the opposite is also important.
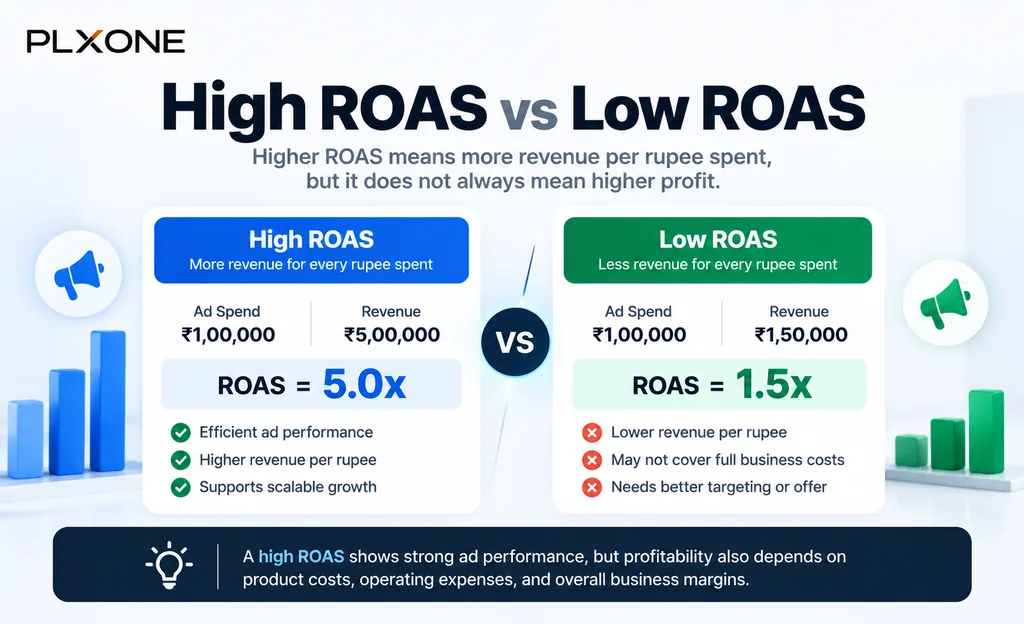
A business with a ROAS of 3 may be in a completely different position from another business with the same ROAS.
Why?
Because the economics behind that revenue can be different.
Look at the product or service margin.
Look at discounts.
Look at fulfilment and payment costs.
Look at returns.
Look at what happens after the first purchase.
So instead of asking:
“What is a good ROAS?”
I would ask:
“What ROAS does this business need for the numbers to work?”
A ROAS of 3 might work for one business and be completely unacceptable for another.
That’s why I don’t recommend copying a ROAS benchmark from another business and treating it as your target.
Your good ROAS is the ROAS that works with your business economics.
The number on the dashboard is only the starting point.
The real question is what that number leaves behind for the business.
Why High ROAS Doesn’t Always Mean High Profit
A high ROAS tells you that advertising generated a strong amount of revenue relative to ad spend.
But revenue is only one part of the equation.
Imagine two businesses both achieve:
ROAS = 5
Both spend ₹1 lakh on advertising and generate ₹5 lakh in revenue.
At first glance, their advertising performance looks identical.
But now look beyond the ad dashboard.
Business A
- Revenue: ₹5 lakh
- Ad spend: ₹1 lakh
- Product and operating costs: ₹3 lakh
There is money left after those costs.
Business B
- Revenue: ₹5 lakh
- Ad spend: ₹1 lakh
- Product and operating costs: ₹4.5 lakh
The same ROAS produces a very different business outcome.
This is why ROAS cannot tell you whether the business is actually profitable.
Your margins, fulfilment costs, discounts, payment fees, returns, and other operating costs all affect what remains after the sale.
There is another important point.
A campaign can also show a strong ROAS because it is generating revenue from customers who were already likely to purchase. That may make the advertising number look better without necessarily creating the level of incremental growth the business expects.
So when ROAS looks strong, don’t stop at:
“How much revenue did the ads generate?”
Ask:
“How much value did that revenue create for the business?”
That is where ROAS needs to be connected with profitability.
ROAS vs Profitability: The Numbers Behind the Difference
Let’s make the difference concrete.
Imagine two businesses both spend ₹1,00,000 on advertising and generate ₹5,00,000 in revenue.
Both have:
ROAS = 5
From the advertising dashboard, they look equally successful.
But now look at what happens after the revenue comes in.
| Business A — Higher Margin | Business B — Lower Margin | |
| Revenue | ₹5,00,000 | ₹5,00,000 |
| Ad spend | ₹1,00,000 | ₹1,00,000 |
| Product cost | ₹2,00,000 | ₹3,25,000 |
| Shipping, payment & other costs | ₹50,000 | ₹75,000 |
| Profit | ₹1,50,000 | ₹0 |
| ROAS | 5 | 5 |
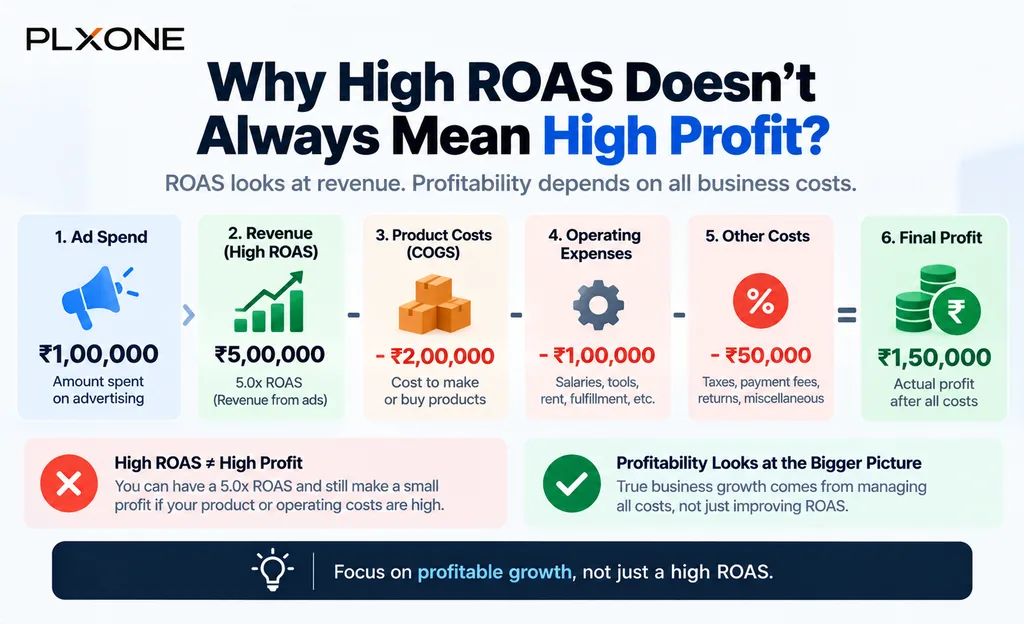
Both businesses have exactly the same:
Revenue: ₹5 lakh
Ad spend: ₹1 lakh
ROAS: 5
But one generates ₹1.5 lakh profit, while the other generates ₹0 profit from the same revenue and advertising spend.
That is the difference between advertising efficiency and business profitability.
ROAS tells you what happened between ad spend and revenue.
It does not tell you what happened between revenue and profit.
This is why a business should not automatically increase its advertising budget simply because ROAS looks strong.
Before scaling, you need to understand what that revenue contributes after the costs of generating and fulfilling the sale.
A strong ROAS can be a good signal. But the business outcome depends on what remains after the sale.
When Should You Use ROAS?
ROAS becomes useful when you are making decisions about your advertising—not simply checking whether a campaign is running.
For example, imagine you are running three campaigns:
| Campaign | Ad Spend | Revenue | ROAS |
| Campaign A | ₹50,000 | ₹1,50,000 | 3 |
| Campaign B | ₹50,000 | ₹2,50,000 | 5 |
| Campaign C | ₹50,000 | ₹1,00,000 | 2 |
At first glance, Campaign B looks like the obvious winner.
And if everything else is comparable, it may deserve more attention.
But now ask a better question:
What happens if I increase the budget?
If Campaign B’s ROAS falls from 5 to 2.5 when you scale it, increasing the budget blindly may not produce the result you expected.
This is where I find ROAS most useful.
Use it to compare, monitor, and investigate changes in advertising performance.
If ROAS suddenly drops, investigate why.
If ROAS improves, understand what changed.
If one campaign consistently outperforms another, investigate what is different.
A Practical Scaling Rule
Before increasing the budget, use this simple check:
| Check | What to Look For | Decision |
| ROAS target | ROAS is above the minimum your business needs | If yes, continue checking |
| Performance stability | ROAS, CAC and conversion rate stay within an acceptable range without large unexplained swings | If yes, continue checking |
| Business economics | Margins and profitability can support additional acquisition | If yes, continue checking |
| Budget increase | Increase spend gradually rather than making a large jump | Monitor the next performance period |
| After scaling | ROAS and CAC remain within your acceptable range | Continue scaling |
| Performance deteriorates | ROAS drops significantly or CAC rises beyond what the business can support | Stop increasing spend and investigate |
Stable performance does not mean the ROAS has to be exactly the same every day.
For example, a campaign consistently producing a ROAS around 3–3.5 gives you a stronger basis for a scaling decision than one jumping from 2 to 6 to 2 over a few days.
That gives you a much better rule than:
“ROAS is high, so let’s spend more.”
Instead:
“ROAS meets our target, performance is consistently within an acceptable range, the economics work, and the next budget increase still produces acceptable results—then we scale.”
So I would not use ROAS as a simple “good or bad” score.
I would use it as a signal that tells me where I need to look next.
ROAS tells you what deserves investigation. The business numbers tell you what action to take.
ROAS vs CAC: Two Metrics, Two Questions
ROAS and CAC are often discussed together, but they answer different questions.
| Metric | What it tells you | Practical question |
| ROAS | Revenue generated relative to advertising spend | “How much revenue did my advertising generate?” |
| CAC | Cost required to acquire a customer | “How much did it cost me to acquire each customer?” |
That difference matters.
You can have a strong ROAS and still have an acquisition cost that doesn’t make sense for your business.
And you can have a reasonable CAC while the overall advertising economics are still weak.
I learned the importance of looking beyond one metric from my own Google Ads experience.
I was spending around ₹2.5 lakh a month, and the revenue generated from that ad spend was around ₹95,000.
The ROAS was only 0.38.
But looking only at ROAS still wouldn’t tell me the complete story.
I would also want to know:
- How many customers did that spend actually acquire?
- What was the CAC?
- What was the average order value?
- What margin did each customer generate?
- Did those customers purchase again?
That’s where the two metrics start working together.
ROAS helps you understand the revenue efficiency of advertising.
CAC helps you understand the cost of acquiring customers.
Neither one, by itself, tells you whether the business is making money.
The useful question is not:
“Which metric should I use?”
It is:
“What is each metric telling me about the business?”
That is how I would use ROAS and CAC together—not as competing numbers, but as two different pieces of the same growth picture.
How to Improve ROAS Without Chasing the Number
When I look back at my Google Ads experience, one thing stands out.
I was spending around ₹2.5 lakh a month, but the revenue generated from that ad spend was only ₹95,000.
The ROAS was 0.38.
Looking back, I believe my bidding strategy and targeting were wrong. Eventually, I stopped running those campaigns.
That experience taught me an important lesson: spending more on advertising doesn’t automatically mean generating more revenue.
If I were investigating a campaign like that today, I would not start by increasing the budget or trying to improve ROAS at any cost.
I would investigate three things first.
1. Check Where the Money Is Going
Look at which campaigns, search terms, audiences, and placements are consuming the budget.
Are they generating relevant traffic and conversions, or simply spending money without producing meaningful results?
The goal is to identify where the money is being spent without a reasonable business return.
2. Check What Happens After the Click
More clicks do not necessarily mean more customers.
I would investigate whether the landing page matches the advertisement, whether the offer is clear, and whether potential customers can complete their purchase without unnecessary friction.
If the problem is on the website, changing the advertising campaign alone may not solve it.
3. Check Whether the Revenue Makes Business Sense
Even if ROAS improves, I would still check product margins, acquisition costs, returns, and other costs that affect profitability.
A campaign should not be judged only by how much revenue it generates. It should also be evaluated by the value that revenue contributes to the business.
My approach would be to measure, identify, investigate, optimize, and measure again.
I would make changes based on the evidence, then check whether those changes improved the outcome.
The objective is not to achieve the highest possible ROAS on a dashboard.
It is to generate revenue that supports sustainable, profitable growth.
The PLXONE Perspective on ROAS
At PLXONE, we believe advertising performance should be evaluated in the context of business growth.
A strong ROAS is useful, but it doesn’t tell the whole story. What matters is whether advertising is bringing the right customers, generating sustainable revenue, and supporting profitability.
That’s why we don’t look at advertising metrics in isolation.
We look at how the different parts of the growth system work together:
- Strategy: Are we targeting the right customers with the right offer?
- Traffic: Are our campaigns attracting relevant potential customers?
- Digital Experience: Does the website give visitors a clear path to purchase?
- Conversion: Are we turning enough of that traffic into customers?
- Customer Experience: Are we creating reasons for customers to return?
- Analytics & Measurement: Can we connect marketing performance to meaningful business outcomes?
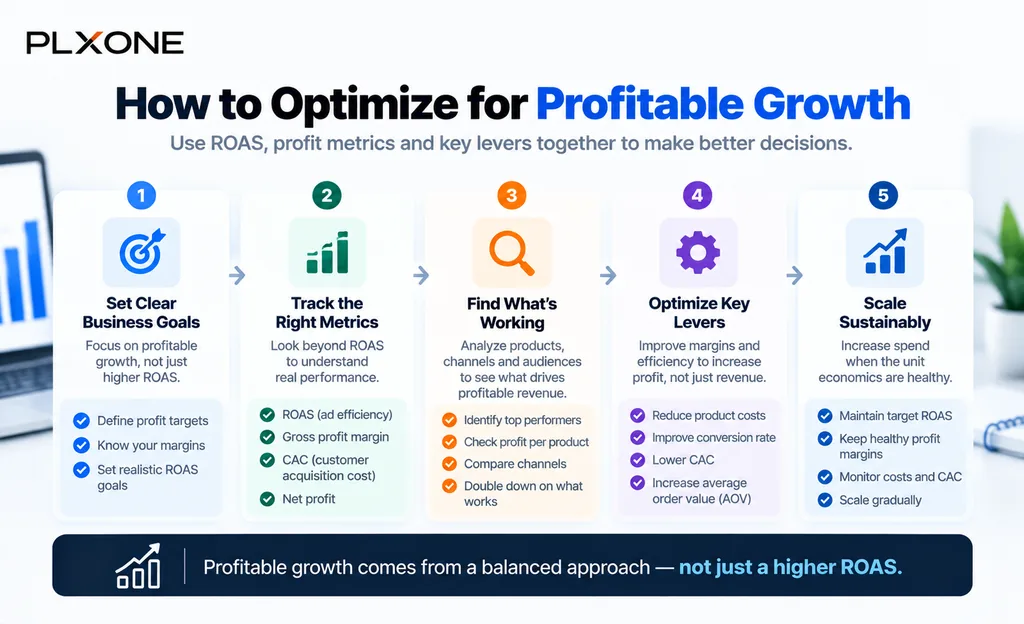
A weak result in one area can affect the performance of the entire system. Increasing the advertising budget won’t necessarily fix it.
Our approach is to measure, identify, investigate, optimize, and measure again.
Because the objective isn’t simply to improve a marketing metric.
It’s to build a growth system where marketing performance and business profitability work together.
FAQ
What does ROAS mean in marketing?
ROAS stands for Return on Ad Spend. It measures the revenue attributed to advertising relative to the amount spent on that advertising.
How do you calculate ROAS?
Divide the revenue attributed to advertising by the advertising spend. For example, ₹5,00,000 in attributed revenue from ₹1,00,000 in ad spend gives a ROAS of 5, or 500%.
What is a good ROAS?
A good ROAS depends on your product margins, operating costs, and profitability targets. A number that works for one business may not work for another.
Can you have a high ROAS and still lose money?
Yes. Revenue from advertising must cover product costs, advertising spend, fulfilment, payment fees, returns, and other business expenses. A high ROAS does not guarantee profitability.
What is the difference between ROAS and CAC?
ROAS measures attributed revenue relative to advertising spend. Customer Acquisition Cost (CAC) measures the cost of acquiring a customer. Together, they help businesses understand advertising performance and acquisition economics.
Pingback: Customer Acquisition Strategy Using Meta Ads